How Did We Get to this Status Quo?
How to create a neighborhood, part 1
Freddie Gray was not the first Baltimorean to die suspiciously after encountering Baltimore City police. His death however, generated a wave of protests not seen since 1968. While protesters took to the streets to critique anti-black police violence, it’s important to emphasize the significant role economic violence played and continues to play in shaping the life chances of Baltimore’s residents, a form of violence that causes a type of slow death that can be easily ignored because it is less spectacular than the specific type of police violence that claimed Gray’s life.
Freddie Gray was raised in Sandtown-Winchester. He had his fateful encounter with police in this neighborhood. According to a 2011 health profile the neighborhood’s median household was lower than $23,000, less than 60% of that of Baltimore City as a whole. Its unemployment rate (21%) was almost double that of the city while the neighborhood’s poverty rate (approximately 31%) is double that of the city. Unsurprisingly the neighborhood is under-educated—only 6% of the neighborhood’s residents have 4-year college degrees (or more), and over 75% of its residents have either a high school degree or less.
The neighborhood has double the number of tobacco stores and almost double the number of liquor stores as the city on average—56.1 and 8.1 stores per 10,000 residents compared to 21.8 and 4.6. Its lead paint violation rate is over three times the city’s (39.8 per 10,000 residents vs. 11.8). It has over four times the vacant building density (2411.5 per 10,000 housing units vs. 567.2) and over 2.5 times the vacant lot density (1507.1 per 10,000 housing units vs. 593.1) (Ames et al. 2011).
Maryland spent almost $1 billion on incarceration in 2010. Baltimore residents represent over 1/3 of the state’s incarcerated population. The neighborhood Freddie Gray lived in sends more of its residents to Maryland prisons than any other Baltimore neighborhood and is one of only five Baltimore neighborhoods to spend $10 million or more on incarceration {Justice Policy Institute, 2015 #8165}. Given this it should be no surprise that at birth the average Sandtown-Winchester/Harlem Park resident can expect to live only 65.1 years as opposed to 71.8 in the city as a whole (Ames et al. 2011).
How to create a neighborhood, part 2
These inter-related dynamics are deeply connected to Baltimore’s history of racial segregation. Many of the major tactics used to create state-supported segregation were created by Baltimore civic and economic elites. In 1910, Baltimore was the first city to enact comprehensive racial zoning laws, designing residential blocks as White or Black based on the majority population. And while in 1917 the Supreme Court deemed this move unconstitutional, Baltimore elites went around their ruling by a combination of racially restrictive[2] covenants, biased enforcement of urban housing codes[3], segregated public housing, strategically locating public housing sites to reinforce segregation[4], the creation of local government segregation committees[5] and all-white civic improvement associations[6], real estate licensing regulations[7], zoning[8], and federal government sponsored risk categories that private and public actors used to determine which neighborhoods were eligible for mortgage loans (Pietila 2010; Rothstein 2015). This latter tactic gives us the term “redlining” used to refer to the process of marking neighborhoods red on the (President Roosevelt created) Federal Housing Administration’s Home Owners Loan Corporation’s (HOLC) map:
The neighborhoods colored red…evidenced ‘detrimental influences in a pronounced degree, undesirable population or an infiltration of it.’ Because of such trends, ‘some mortgage lenders may refuse to make loans in these neighborhoods and others will lend on a conservative basis.’ By redlining, HOLC said, ‘we do not mean to imply that good mortgages do not exist or cannot be made in the Third and Fourth grade areas, but we do think they should be made and serviced on a different basis than in the First and Second grade areas.’ A lasting stigma became attached to such areas. A two-tier lending industry was born. Banks served well-to-do white areas; blacks had to get their financing from speculators at harsh terms. (Pietila 2010, p. 70)
The FHA insured 60% of all homes purchased in the United States between 1930 and 1950 and during this period less than 2% of FHA loans were made to non-whites (Seitles 1998). The mortgages the FHA insured were one of the most democratic means of generating wealth in America as it gave working and middle class citizens the ability to grow wealth through home purchases. However, as these loans were racially exclusive, the FHA basically developed a white middle class at the expense of black poor and working class citizens (Katznelson 2005). Since blacks were precluded from participating in the housing “free market,” they were forced to purchase homes through contract sales, a particularly pernicious practice that forced blacks into contracts preventing them from owning the home they “purchased” until they paid off the entire amount. Further, it gave the person owning the contract the ability to take the home away from the contract purchaser if the purchaser missed even a single payment (Coates 2004). Because the decisions they made with regard to mortgage financing extended into the suburbs, the only suburbs open to blacks were suburbs that were already poor and predominantly black to begin with.
Less than ten years after the HOLC map was created, the United States went to war. Congress passed two pieces of legislation that also influenced segregation patterns in Baltimore and other major cities. The first was the GI Bill. The GI Bill promised military veterans free education, low-interest loans to start businesses, and low-cost mortgages. The second was the National Interstate Highway and Defense Act (1956), responsible for creating our nation’s freeway system.
While neither bill explicitly prevented Black people from gaining access to the resources provided (certainly blacks weren’t precluded from driving on freeways), whites benefitted far more than blacks. In the first instance, black veterans were racially excluded from attending many of the schools white veterans could attend. Further, black veterans could not take advantage of the low-cost mortgages because they could only use the mortgages to purchase homes in the suburbs that blacks were already excluded from. Additionally, black homebuyers and drivers had to avoid what sociologist James Loewen (2005) and others call “sundown towns” which excluded the presence of black people after sunset, often with the threat of violence. There were thousands of these towns across America, many of them located in the Midwest and North regions of the country.
In sum, federal, state, and local public policy had a few different pernicious effects. First, it placed an explicit value on the racial composition of city neighborhoods with all-white neighborhoods receiving far better property evaluations than non-white ones. Second, it concentrated poverty and a range of social ills in black neighborhoods, and increasingly in cities with large black populations, while generating wealth and privileges in white ones. Third, it limited black mobility in disinvested, redlined Black neighborhoods, which significantly reduced the ability of blacks to make money on the properties they owned. Finally, it reproduced these results over time. Indeed, long after redlining was made illegal, the conditions of redlined communities are still problematic, still bear starkly-clear and tangible evidence of its effects.
The implications of the above narrative suggests that as a result of historical and contemporary processes a significant portion of Baltimore’s population is far more likely to die a slow than a sudden death[9]. Ignoring the persistent issues neighborhoods like Sandtown-Winchester face has consequences. Intellectually we ignore the deeply gendered and classed nature of this violence–the vast majority of Sandtown’s incarcerated are working class black men, while the vast majority of those left behind by failing welfare services are working class women and children. Politically we devise solutions that focus too much on changing police practices and not enough on the structural conditions that normalize police activity.
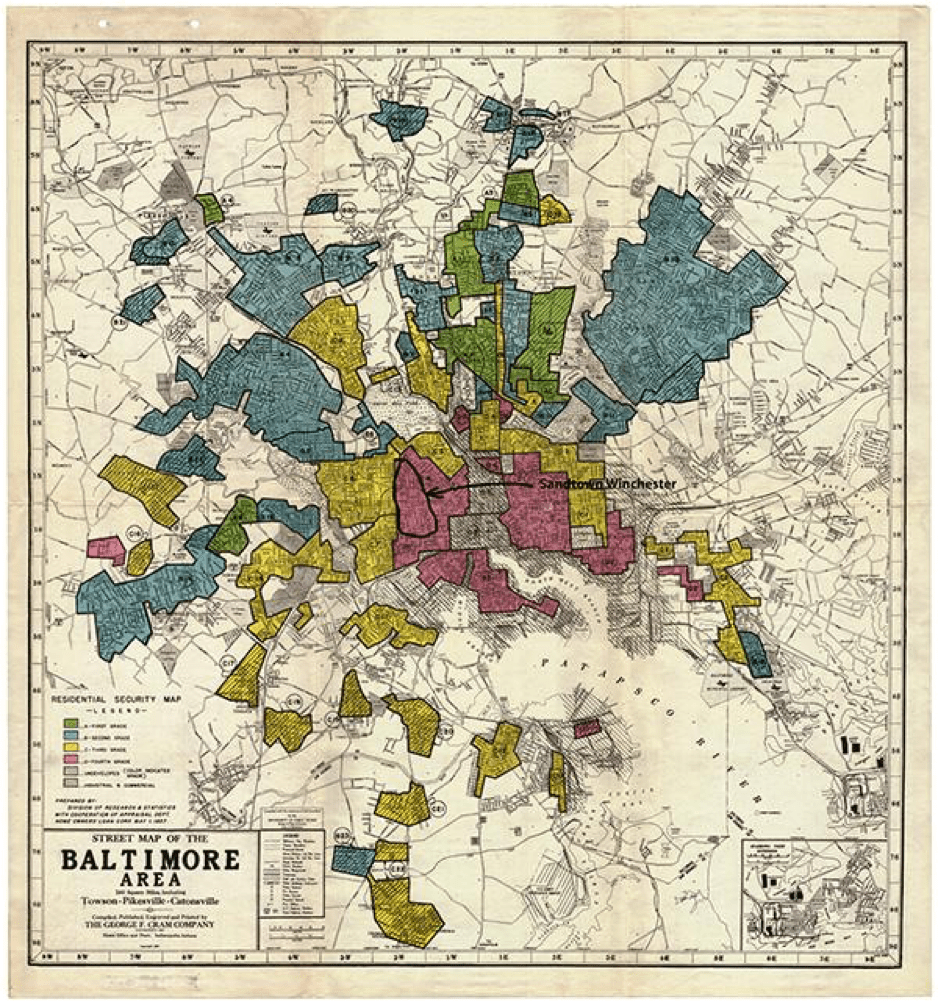
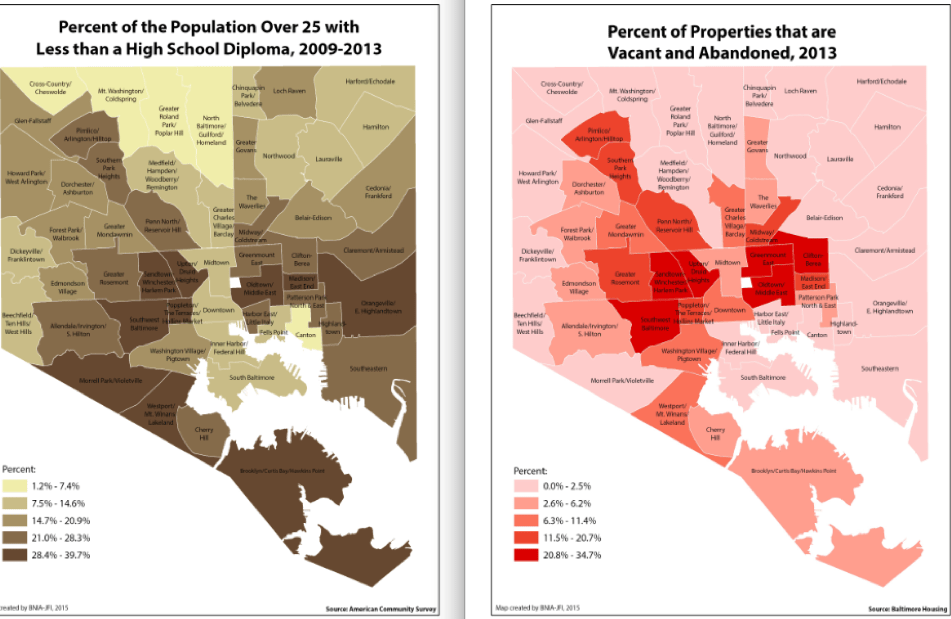
On the top we have the original HOLC map of Baltimore, with neighborhoods designated “high-risk” colored red. Underneath that image we have two contemporary maps (generated by the Baltimore Neighborhood Indicator Alliance[10] and taken from Dr. Marisela Gomez’ website[11]). Although almost 80 years separates the top and bottom images, the conditions don’t seem to have changed much–the neighborhoods that were deemed investment risks because of their racial demographics in the early thirties are now the neighborhoods that have the highest percentage of abandoned properties and the highest high school drop-out rates.
[2]Private covenants between buyer and seller that constricted the buyer’s ability to sell to populations deemed undesirable by the seller.
[3]The mayor tasked inspectors to cite anyone who sold a home in a predominantly white neighborhood to blacks.
[4]This was achieved via the Housing Authority of Baltimore City (HABC) established in 1937 by Baltimore mayor Howard Jackson. See Arnold Hirsch’s research paper “Public Policy and Residential Segregation in Baltimore, 1900-1968.”
[5]The City of Baltimore created an official committee on segregation to coordinate public and private efforts to prevent neighborhood desegregation.
[6]To promote the use of racially restrictive covenants.
[7]Which withheld and/or rescinded real estate licenses from individuals who sold property in white neighborhoods to blacks or Jews.
[8]Which used municipal authority to establish white and black only neighborhoods.
[9]Slow violence is a concept articulated by Rob Nixon in such articles as “Slow Violence, Gender, and Environmentalism of the Poor.”
[10]http://bniajfi.org/community_mapping/
[11]http://www.mariselabgomez.com
